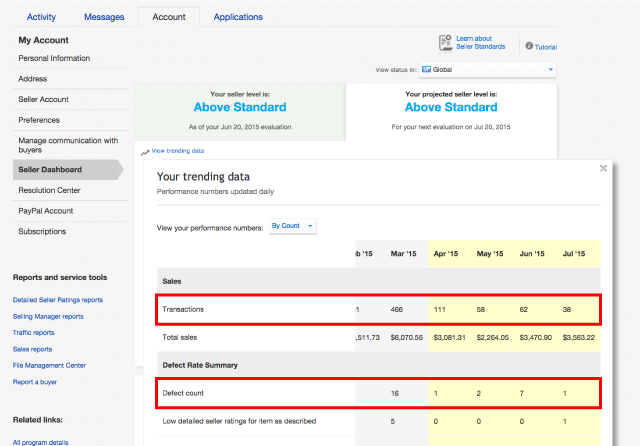
Defect Defender
Now merchants don't have to do excel calculation regularly but using Viewider defect defender to forecast the transaction target before next evaluation cycle.
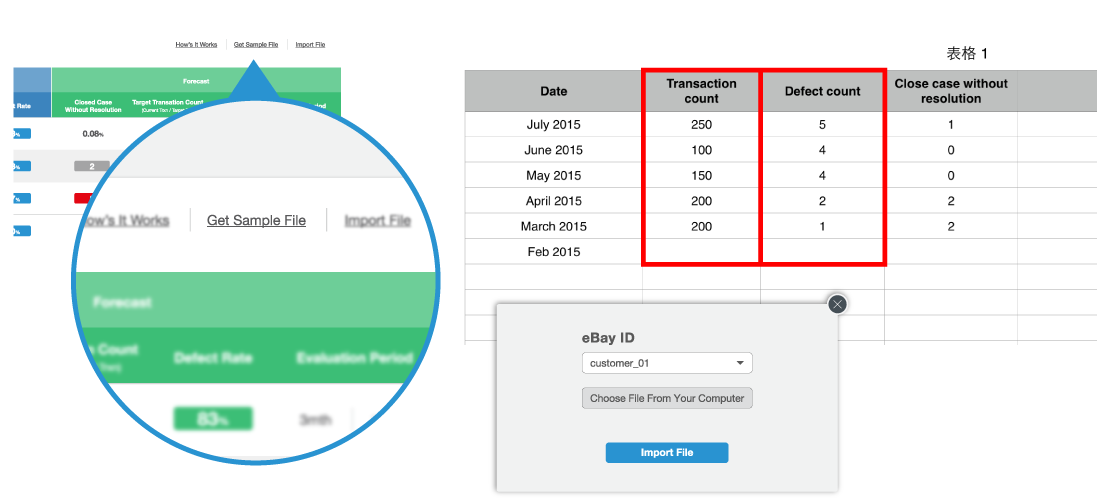
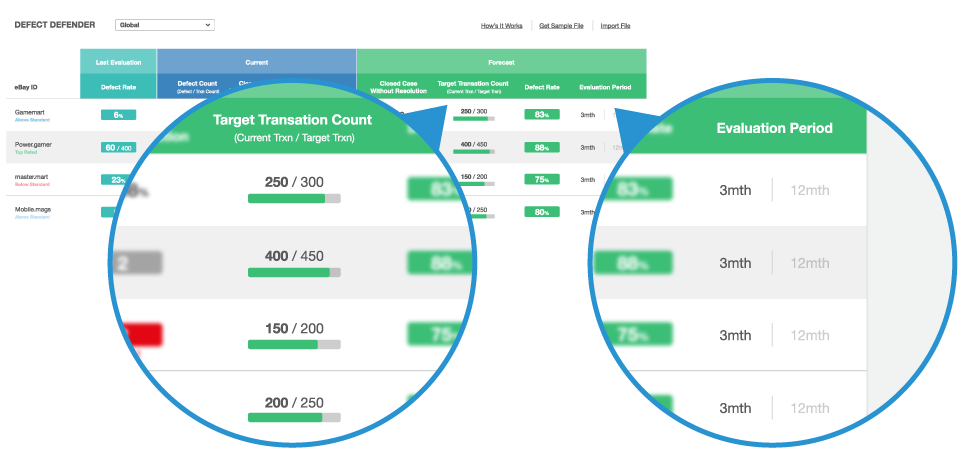
Defect Defender
Now merchants don't have to do excel calculation regularly but using Viewider defect defender to forecast the transaction target before next evaluation cycle.
Fixed Price Listings Exposure
The fixed price listings will be divided as four groups according to its recent sales record.
- High exposure = last 7 days have sold record listings
- Mid High exposure = last 30 days have sold record but none in past 7 days
- Mid Low exposure = last 60 days have sold record but none in past 30 days
- Low exposure = No sold record in past 60 days
Inventory utilization
Viewider visualize the daily performance fixed price listings exposure table by bar chart format.
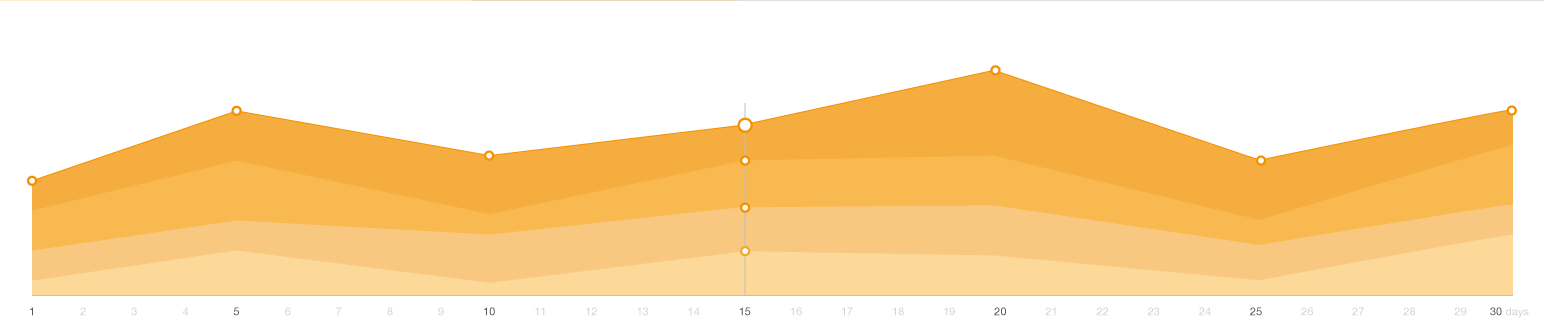
Inventory Utilization Trend Data
The trend data history allow you to review past 30 days inventory utilization change by each eBay ID.
Today GMV ()
$
0.00
Show all IDs Figure
Day over day
0
%Organic GMV
0.00
DoD
+
(+
%)Optimizer GMV
0.00
DoD
+
(+
%)Cross-sell Item
$2,500.00
+$500 (+20%)
Markdown Listings
$3,000.00
+150 (+5%)
New Listings
0.00
DoD
+
(+
%)Total Listing Count
| Sold history () | Listings | |
| 0 | Refine by Batch Get List | |
| 0 | Refine by Batch Get List | |
| 0 | Refine by Batch Get List | |
| 0 | Refine by Batch Get List |

Optimizer Count
Successful Performance
GMV Boosted